Insights provides a consolidated view of all your campaigns. You can view month-by-month trends attributed to individual events, firmographic data, and your most engaged accounts.
Additionally, you can use filters to drill down into single events or conference sessions.
Campaigns: type and activity
The Campaigns tab displays information about every event that you have sponsored.
The type of event - physical, hybrid, virtual, or webinar - is displayed on the Campaign Type tab.
The Activity tab shows the total number of interactions, including booth scans, how many leads attended your sponsored sessions at each event, content downloads, and webinar attendance.
Net new leads
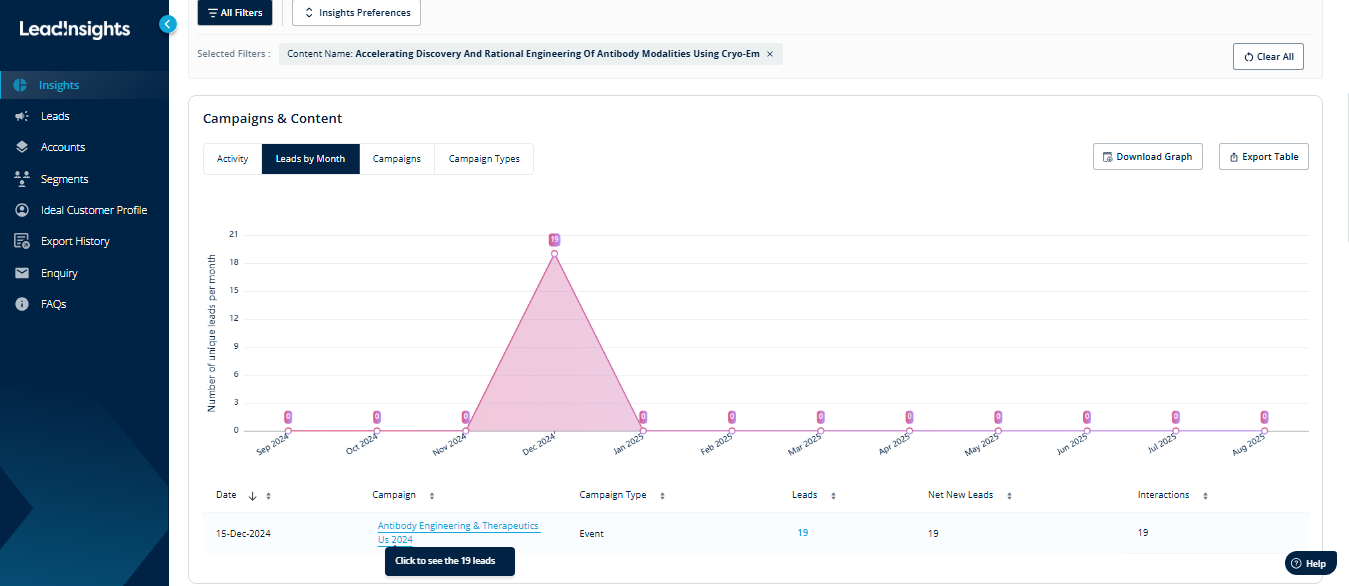
The dashboard displays columns for Leads and Net New Leads.
When you meet a new lead that you haven't previously interacted with, they will be added to both the Leads and Net New Leads columns.
The Leads column represents the total number of leads you have interacted with at one or more events.
All Filters
Use the All Filters function to generate a list of leads who attended individual conference sessions or watched a webinar. You can add those leads to a segment or export them to a CSV file.
Click the All Filters button, then select your chosen session under Activity Name.

The dashboard will display your leads, net new leads, and interactions for that session. Scroll down the page to see more insights about this group of leads, including firmographic and most engaged.
Click on the campaign name to see the leads. You can now add to a segment, export a CSV file, or request a campaign.
Was this article helpful?
That’s Great!
Thank you for your feedback
Sorry! We couldn't be helpful
Thank you for your feedback
Feedback sent
We appreciate your effort and will try to fix the article